The localization industry entered 2026 with a paradox: the headline market is barely growing, and the volume of work has never been higher. Prices per word are falling, machine translation is standard equipment rather than a differentiator, and yet streaming platforms, regulated industries and software companies keep shipping more languages than they did last year. The ten figures below are the ones that make that contradiction legible.
Every number here is published data, and every one is linked to the source where it appears. Two of them come from our own systems, the TranslaStars Jobs Board and the Talent Pool, read live on 12 November 2026. Where a figure is a forecast, the text says so.
In This Article
- 1.$72.6 Billion: The Industry Grew Less Than 1%
- 2.$50.55 Billion: The Other Market Sizing, in Real Terms
- 3.80%: Machine Translation Is Standard in LSPs
- 4.63%: Freelancers Have Joined the Automation Wave
- 5.63%: Rates Did Not Move in 2025
- 6.76% and 40%: The Consumer Case for Localization
- 7.$2.79 Billion: Where Media Localization Is Heading
- 8.9.06%: Dubbing Outgrows the Rest of the Market
- 9.Thousands of Jobs: What Is Actually on Offer
- 10.11,847: The Supply Side, Counted
- What It Means for You
- Where to Go Next
1. $72.6 Billion: The Industry Grew Less Than 1%
 Nimdzi Insights puts the global language industry at USD 72.6 billion in 2025, and projects USD 73.4 billion for 2026. From there the report expects a compound annual growth rate below 1.0% for the rest of the decade, reaching USD 76.1 billion by 2030. That is not a collapse. It is something more uncomfortable for anyone who built a business plan on double-digit growth: a mature market.
The reason the top line is flat is not that demand disappeared. It is that the unit of work changed. A billion words that used to be translated by hand at a per-word rate can now be translated by a machine and reviewed by a human at a fraction of the price, so revenue per word falls even as the number of words rises. The industry keeps doing more work for roughly the same money.
Read the number as a budgeting constraint, not a verdict. Growth has not stopped; it has moved. It now sits in specific segments, specific language pairs and specific service lines rather than in the market as a whole, and the rest of this article is about where those pockets are.
Source: The 2026 Nimdzi 100. The 72.6 and 73.4 billion figures and the sub-1% CAGR are stated in the report's market section. The 2026-2030 figures are a projection, not a measurement.
2. $50.55 Billion: The Other Market Sizing, in Real Terms
 CSA Research measures the language services and solutions sector differently, and its number is lower: USD 50.55 billion in 2024, up 1.8% from USD 49.68 billion in 2023. The nominal growth is the part everyone quotes. The part that matters is the next sentence in the report: once adjusted for inflation, that 1.8% gain becomes a 1.1% decline.
CSA's preliminary figure for 2025 is worse. Its forecast is USD 48.67 billion, a 3.7% drop from 2024, or roughly 6.3% in constant dollars. This is the same story as the Nimdzi number told from the supply side: LSP revenue is contracting in real terms while the amount of content crossing borders keeps rising.
Two credible firms, two different totals. Nimdzi's definition is broader and includes technology revenue; CSA surveys a representative sample of language service providers. When two measurements with different scopes agree on the direction, the direction is the finding. Both say the same thing about 2025 and 2026: flat to negative, with a reshuffle underneath.
Source: CSA Research, 2025 Market Sizing: Year End Update (PDF, December 2025). The 49.68 and 50.55 billion figures, the 1.8% nominal growth, the 1.1% real decline and the 48.67 billion forecast for 2025 all appear in the opening section.
3. 80%: Machine Translation Is Standard in LSPs
RWS surveyed nearly 2,000 localization professionals for its Translation Technology Insights 2025 report. Machine translation is used in production workflows by around 60% of all respondents and roughly 80% of language service providers. Not piloted, not evaluated: used.
The gap between those two figures is the most useful part. Corporate translation teams sit at the lower end, because legal review, brand approval and procurement slow adoption down. Language service providers sit at the top, because their clients pay for throughput and MT is the only way to deliver it at the prices now on the table.
For a professional, the practical consequence is that refusing to work with MT is no longer a neutral career choice. It removes you from the segment where most of the volume is. The differentiator has moved from whether you use the technology to how well you control its output, which is a skill measured in quality, consistency and speed rather than in tool familiarity. The mechanics of that control, from routing rules to quality gates, are what the AI-driven localization pipelines course covers.
Source: MultiLingual, reporting the RWS Translation Technology Insights 2025. The article states MT was "used by around 60% of respondents overall and by roughly 80% of language service providers."
4. 63%: Freelancers Have Joined the Automation Wave
The European Language Industry Survey 2026 collected responses from 1,058 participants across 45 countries. Among independent language professionals, 63% report using automated translation in some form. The report breaks that down further: the usage splits roughly evenly between post-editing content a client pre-translated and running MT or AI tools directly on their own work.
That split says something the aggregate number hides. Half of the automation a freelancer touches arrives as a client deliverable, not as a personal choice. The job becomes to repair and improve a draft someone else's engine produced, which is a different skill from translating from scratch and is rarely taught as such.
The other half is self-directed. Translators who run their own MT or LLM pass and then edit the result are effectively building a private production line, and the ones who do it well report the productivity gain without the quality drop that makes post-editing unprofitable. The method behind that balance is taught in the machine translation and post-editing course.
Source: ELIS 2026 Report (PDF), published by the European Language Industry Survey consortium. Respondent counts, the 45-country coverage and the 63% automation figure appear in the report's methodology and post-editing sections.
5. 63%: Rates Did Not Move in 2025
The same ELIS 2026 report records what happened to prices. 63% of respondents did not change their rates in 2025. One in four independent professionals raised them, and 12% cut them. The report's summary is blunt: rates went down across segments, and respondents do not expect them to rise in 2026.
Hold that against the previous number. Productivity per hour is rising because of automation, and prices are flat. The gain from the technology is therefore being captured somewhere other than the freelancer's invoice, either by the client as lower cost or by the intermediary as margin.
The exception matters for planning. The 25% who raised prices did so in a flat market, which means pricing power still exists, just not universally. It tends to follow specialisation, direct client relationships and services sold as outcomes rather than as words. That is a smaller group than the industry would like, and it is the group worth modelling your career on. Part of what they do differently is explain the work in business terms, which is the subject of the course on communicating the value of localization.
Source: ELIS 2026 Report (PDF), rates section. The 63% unchanged, one-in-four increase and 12% decrease figures are stated in the same paragraph.
6. 76% and 40%: The Consumer Case for Localization
CSA Research's Can't Read, Won't Buy study surveyed 8,709 consumers in 29 countries. Two findings have been quoted in every localization pitch deck since: 76% of online shoppers prefer to buy products with information in their native language, and 40% say they will never buy from websites in other languages.
These are demand-side numbers, and they explain why localization budgets survive flat market reports. The buying decision is not made in English and then translated in the customer's head. For a large share of buyers, a site in another language is not a worse option, it is not an option.
The 40% is the number to put in front of a finance team. A preference can be argued with; a refusal cannot. Any market entry plan that treats a non-English market as addressable with an English page is pricing in a hard cap on reach, and the cap is larger than most forecasts assume.
Source: tcworld, reporting CSA Research's Can't Read, Won't Buy, and the CSA report listing. Both the 76% preference and the 40% refusal appear in the published summary of the 8,709-consumer, 29-country survey.
7. $2.79 Billion: Where Media Localization Is Heading
The OTT localization market was valued at USD 1.59 billion in 2025, is estimated at USD 1.75 billion in 2026, and is forecast to reach USD 2.79 billion by 2031, a compound annual growth rate of 9.74% over 2026-2031. In a market growing below 1%, that is close to an order of magnitude faster.
The driver is structural rather than cyclical. Streaming platforms now plan language depth at commissioning, not after launch. Korean content passed 10 billion viewing hours outside South Korea across 20 measured Netflix markets in 2025, and Indian OTT originals drew a quarter of their viewership from overseas. Content that travels is content that was built to travel.
Growth at that rate pulls the rest of the supply chain with it: subtitle vendors, dubbing studios, voice casting, quality control, metadata. It also raises the price of experienced media linguists, which is the labour-market version of the same number. That demand is why we keep a dedicated track on audiovisual translation, subtitling and dubbing.
Source: Research and Markets, OTT Localization market report 2026-2031. The 1.59, 1.75 and 2.79 billion figures and the 9.74% CAGR appear in the report summary. The 2026-2031 values are forecasts.
8. 9.06%: Dubbing Outgrows the Rest of the Market
Inside that picture, dubbing is the sharpest edge. The OTT dubbing segment is estimated at USD 0.74 billion in 2025, USD 0.81 billion in 2026, and USD 1.25 billion by 2031, a 9.06% CAGR across the forecast period.
The operational detail behind the percentage is scale. Major titles now launch with 25 to 40 language versions, a volume that theatrical dubbing budgets were never designed to support. That is only possible because the mix changed: fewer prestige dubs with full lip-sync, more voice-over dubbing and AI-assisted first passes, with human talent concentrated where the audience is largest or the content most sensitive.
For anyone choosing a specialisation, this is the segment where demand is growing fastest and where the talent shortage is most often reported. Voice talent, adaptation writers, dubbing directors and QA reviewers for dubbed audio are being hired against a market that is expanding, not contracting. The workflow side of that, including AI-assisted dubbing, is covered in the AI dubbing and translation course.
Source: Research and Markets, OTT Dubbing market report 2026-2031. The 0.74, 0.81 and 1.25 billion figures, the 9.06% CAGR and the 25-to-40 language-version range are stated in the report summary. Projections cover 2026-2031.
9. Thousands of Jobs: What Is Actually on Offer
Our own jobs board carries thousands of open roles across 39 countries at any given moment: not a curated sample, but a live feed in which duplicates and dead adverts are removed before anything reaches the public board. The exact count moves every day, so what follows is the shape of the market rather than a frozen total.
What employers are actually buying is easy to describe. Translation and interpreting is the largest group by far, followed by multilingual and linguist roles, then localization proper and a smaller layer of quality and review positions. By seniority the pattern is blunt: generalist roles dominate, specialist posts come second, and manager or lead openings are a thin band at the top. The base of the pyramid is wide and the top is narrow, which is the career map in one line.
One detail is worth flagging as a caution rather than a benchmark. Almost none of those postings publish a salary, and the handful that do are too few to describe the market. Where a rate is stated it tends to sit around USD 30 per hour, which is a hint, not an average.
Source: jobs.translastars.com, live statistics read on 12 November 2026 (07:47 CET). The feed groups locations into 39 named countries plus an unmapped bucket. Figures are a point-in-time count and change as the feed refreshes.
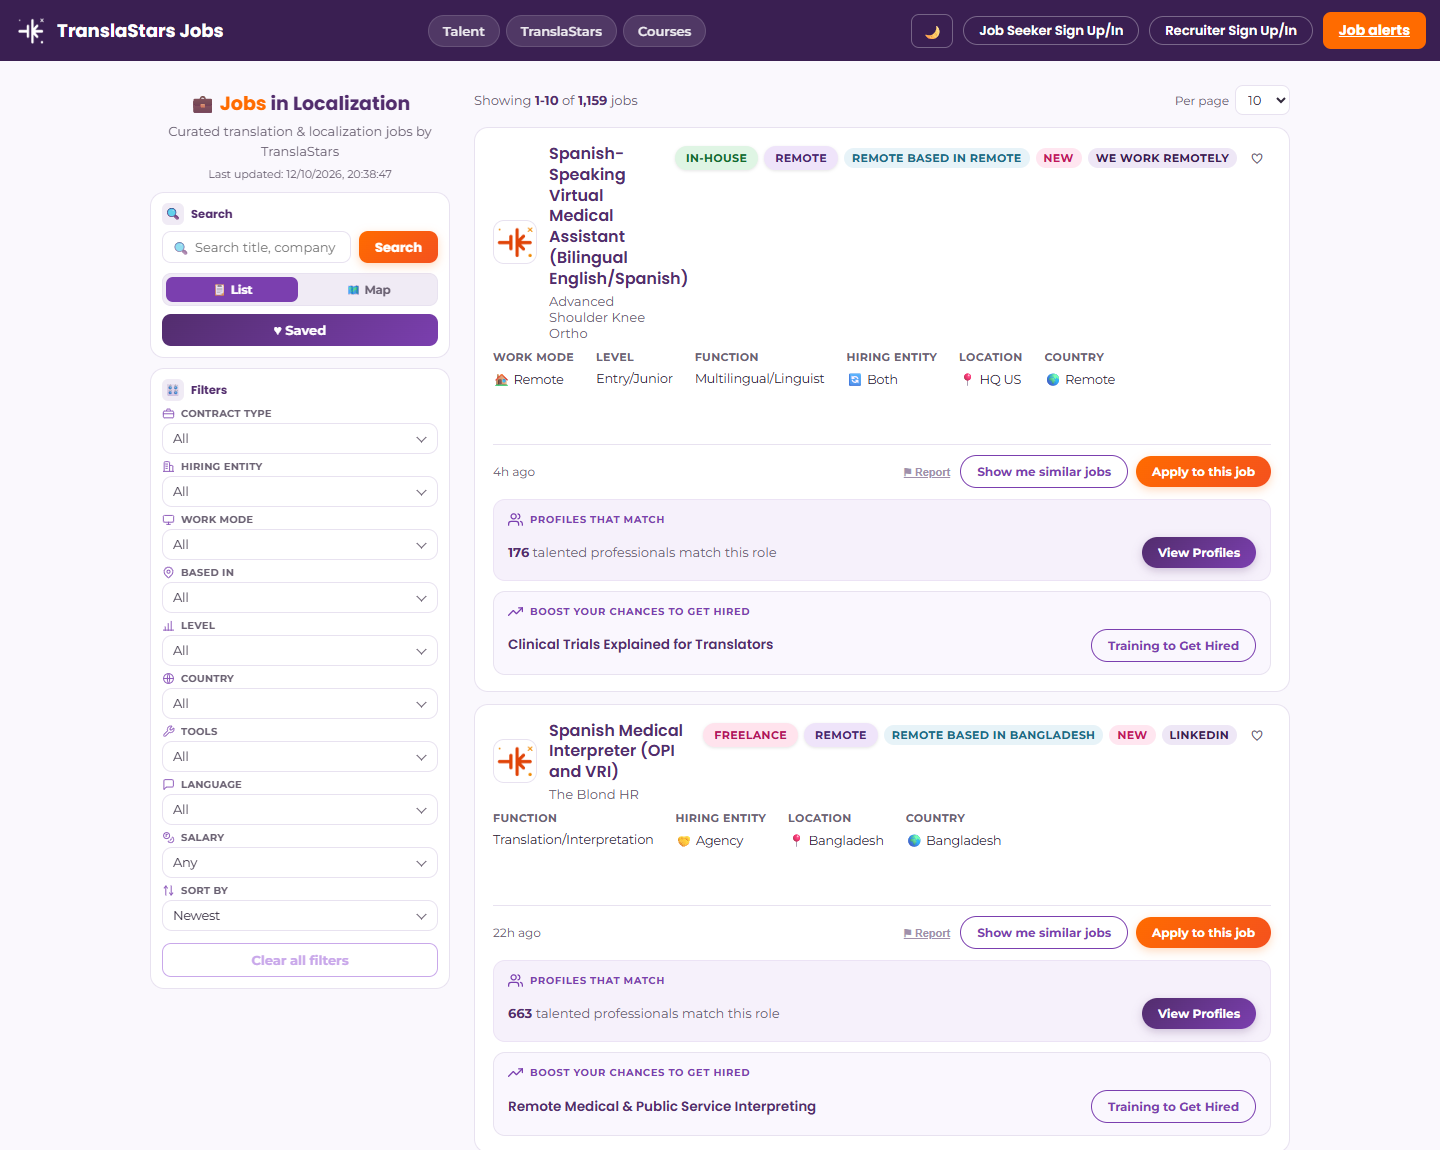
Jobs Board
Thousands of live openings across 39 countries, filtered by function, level, country and work mode, with email alerts for the searches you save.
Talent Pool
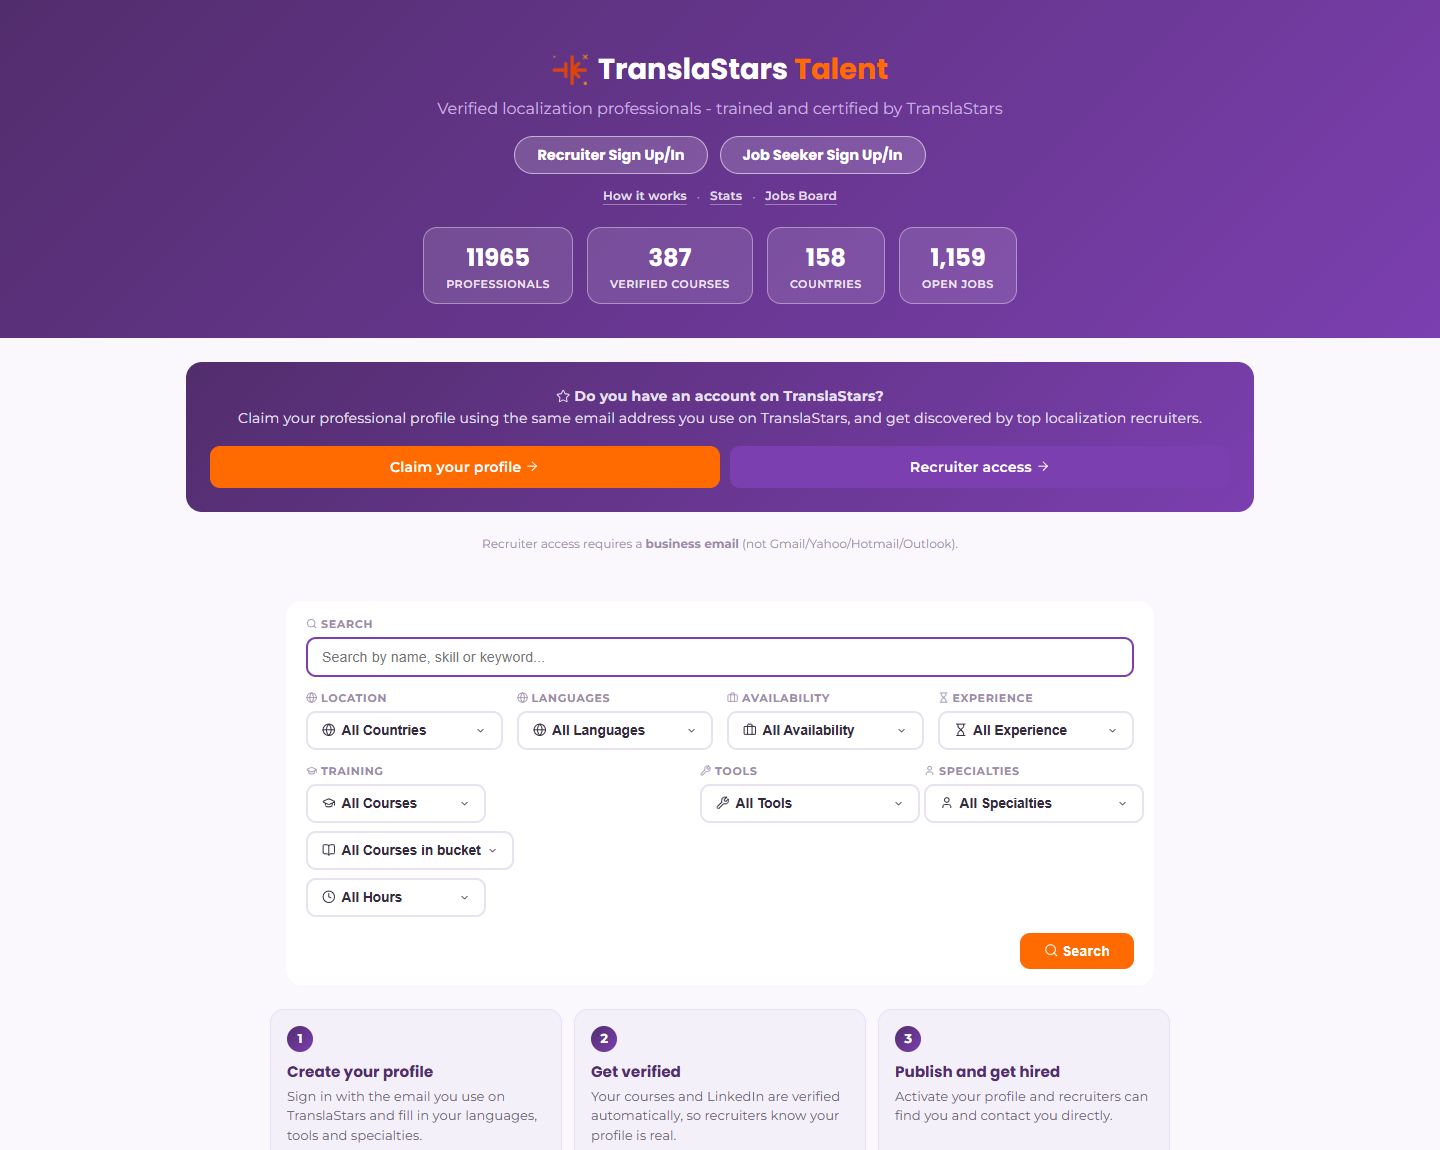
11,847 language professionals in 156 countries, searchable by recruiters who are approved by hand, with your TranslaStars training record attached.
10. 11,847: The Supply Side, Counted
The other half of the market is the people. The TranslaStars Talent Pool held 11,847 registered professionals in 156 countries on 12 November 2026, sitting on top of 383 verified TranslaStars courses. Those are the professionals recruiters search directly, with their training record attached to the same email they use on the platform.
Two things follow from that number. The first is that supply is genuinely global: 156 countries is not a rounding error, it is a distributed workforce that can cover almost any language pair if the matching works. The second is that supply is not the bottleneck. With this many qualified people registered, the scarce resource is discoverability, which is why the board and the pool are connected rather than separate products.
For a professional, being in a directory is not the same as being findable. Profiles that state specialisation, language pairs, tools and availability get matched; profiles that say "translator" do not. The number is large enough that the filter is the product.
Source: talent.translastars.com, live statistics read on 12 November 2026. Counts move daily as profiles are claimed and courses are verified.
What It Means for You
Put the ten numbers together and a coherent picture appears. The market is flat in revenue and rising in volume. Automation is default equipment. Rates are stagnant except for a quarter of professionals who found a way to move them. Consumer demand for local content is not in question. Media localization is growing three to ten times faster than the rest, and both the jobs and the talent are concentrated in a discoverability problem rather than a shortage problem.
Four practical conclusions follow:
- Compete on output, not on words. If 63% of your peers use automation and 63% have not moved their rates, the differentiator is what you deliver, not how fast you type.
- Pick a growing segment. Media localization is compounding at 9-10% while the headline market grows below 1%. Dubbing, subtitling, accessibility and quality review are where the postings are moving.
- Make yourself findable. With 11,847 professionals in 156 countries, the market does not lack translators. It lacks a reliable way to match a specific need to a specific person.
- Read the market before you quote. Board data shows what employers ask for and what they pay when they say. Use it instead of guessing.
The Ten Numbers, in One Table
| # | Figure | What it measures | Source |
|---|---|---|---|
| 1 | USD 72.6B, 2025 | Global language industry, projected USD 73.4B in 2026, sub-1% CAGR to 2030 | Nimdzi 2026 |
| 2 | USD 50.55B, 2024 | Language services and solutions, -1.1% in real terms; 2025 forecast USD 48.67B | CSA Research |
| 3 | 80% | LSPs using machine translation in production (60% of all respondents) | RWS TTI 2025 |
| 4 | 63% | Independent translators using automated translation in some form | ELIS 2026 |
| 5 | 63% | Professionals who did not change their rates in 2025 | ELIS 2026 |
| 6 | 76% / 40% | Consumers preferring native-language product info / refusing other-language sites | CSA Research |
| 7 | USD 2.79B | OTT localization market by 2031, 9.74% CAGR from USD 1.59B in 2025 | Research and Markets |
| 8 | 9.06% | OTT dubbing CAGR 2026-2031, USD 0.74B to USD 1.25B | Research and Markets |
| 9 | Thousands | Live openings on the TranslaStars board, 39 countries, duplicates removed | TranslaStars, live |
| 10 | 11,847 | Professionals in the Talent Pool, 156 countries, 383 verified courses | TranslaStars, live |
Where to Go Next
The numbers point in one direction: more content, tighter budgets, and a premium on people who can run the machinery rather than feed it. The tools below are how we help with each half of that, and they are free to start with.
Skills Store
Ready-to-use skills, prompts and automation built by TranslaStars, each with the guide that shows how it was built.

Courses
The full catalogue, from post-editing and QA to audiovisual translation and localization management, with lifetime access.
If you would rather follow a structured path than pick at random, two programs cover the two sides of this article: the Master in AI and Innovation for Localization for the production and technology side, and the Localization Management Academy for budgets, capacity and vendor strategy. Start with the free options above, and move to a program when you know which gap you are closing.